Ad verification for brands and agencies

How many of the impressions you paid for were real?

We count every impression of your campaign ourselves, remove bots, invalid traffic and duplicates, and show you the gap between what you were billed for and what actually ran.
0B
Ad delivery events measured
0%
Of gross impressions excluded from the net count
<1%
Of media spend, what most customers pay
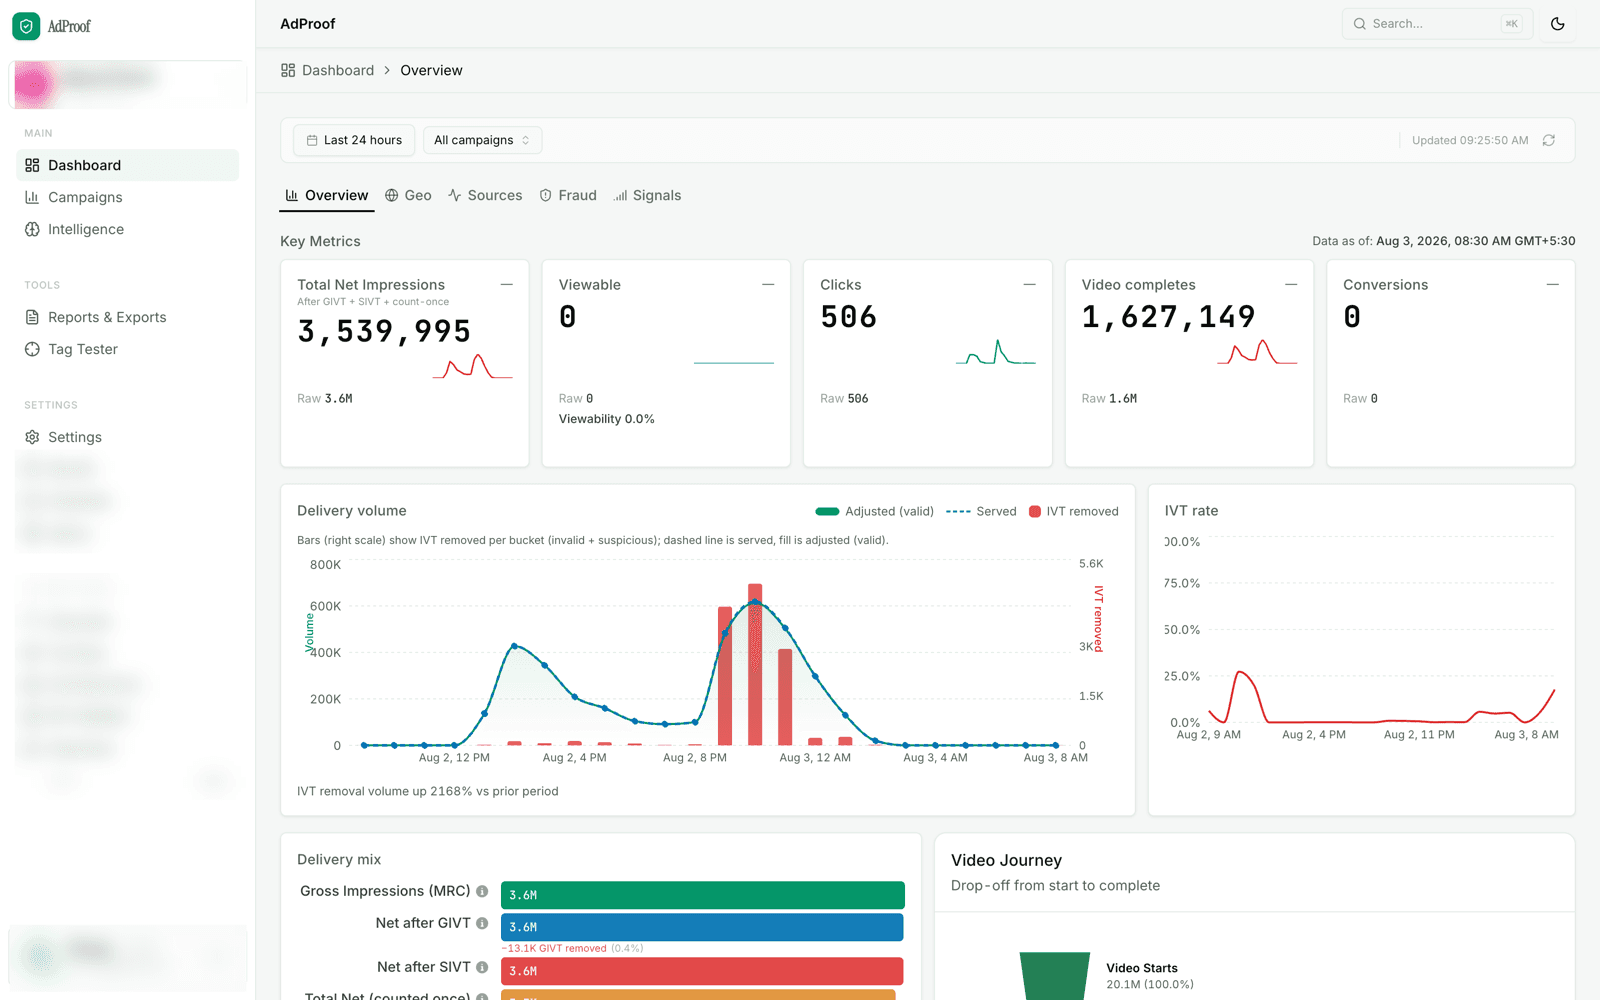
Verification dashboard
Snapshot
The AdProof verification dashboard, with client identifiers obscured
Client data obscured
Measured
1.9B
Net
1.3B
Removed
33.75%
Measuring across
In-stream videoCTV & OTTMobile webOpen web
01 – The gap

Every party in the chain counts the same impression differently.

The DSP counts a win. The exchange counts a served creative. The publisher counts a page event. None of them are measuring whether a person could actually see the ad, and none of them are neutral, because each is paid on the number it reports.

AdProof introduces a fourth count that answers to the buyer. One measurement, applied identically to every channel, reconciled against the invoice.

Reconciliation – every campaign measured, 30 March to 25 October 2026 (partial day)
Gross impressions measured1,931,349,306
The impression share of 2,749,458,589 delivery events. The rest are clicks, video starts, quartiles, and completes.
Net after general invalid traffic1,443,240,590
488,108,716 matched GIVT signatures and came out of the count.
Counted once, after duplicate removal1,279,609,367
163,631,212 were the same impression counted more than once.
Excluded from the net count651,739,939
02 – How it works

Five checkpoints between the impression and the invoice.

Each stage produces its own record. Every impression carries the chain of those records, which is what makes a discrepancy arguable rather than anecdotal.

01
Collect
A tag, SDK, or VAST wrapper reports every delivery event from the client itself, independent of the server that served it.
OUT – measured event
02
Classify
Each impression is scored for general and sophisticated invalid traffic, and every exclusion carries the rule that caused it.
OUT – validity verdict
03
Exposure
Render, pixel geometry, and video quartiles are sampled through the exposure window rather than checked once at the start.
OUT – exposure record
04
Validate
Geography, daypart, and segment are checked against the insertion order, with a reason code on every miss.
OUT – match verdict
05
Reconcile
Verified counts are diffed against the ad server and the invoice, and the difference is filed as a discrepancy.
OUT – discrepancy report
03 – What we measure

Definitions you can hold a vendor to.

All solutions →
IVT
Invalid traffic
General and sophisticated invalid traffic reported separately and counted against gross, never blended into one rate. 488,108,716 impressions have come out as GIVT to date, each carrying the reason code that removed it.
GIVTSIVTReason codesData-centre
Delivery
Served against measured
Gross, filtered, and net on the same impression, per campaign and per source. Of 1,931,349,306 gross impressions measured, 1,279,609,367 survived invalid-traffic filtering and count-once deduplication.
GrossNetCount once
Geography
Where it actually landed
Resolve delivery from country to state to city, and compare it with the geography the campaign was booked for. The 25 October 2026 coverage snapshot contains 195 countries and territories, 3,215 distinct state and region names, and 46,499 distinct city names, excluding unknown locations.
CountryStateCity
Targeting
Delivery match
Whether impressions landed against the geography and the plan on the insertion order, reported as a match rate with a confidence level rather than a yes or no. 5,748,599 impressions have landed outside the target.
ExactPartialMismatch
Frequency
Reach and frequency
Unique reach with duplicate exposure collapsed, plus the frequency distribution behind it, so a reach figure means people rather than cookies.
Unique reachDedupDistribution
Supply
Source quality
One row per observed source with volume, valid share, invalid rate, and target match. 43,521 app and site names across 25,618 networks (ASNs) observed in the 25 October 2026 coverage snapshot, including delivery from supply that was never on the plan.
Valid shareIVT rateOff-plan

Four of the surfaces, as they ship.

Obscured for client confidentiality
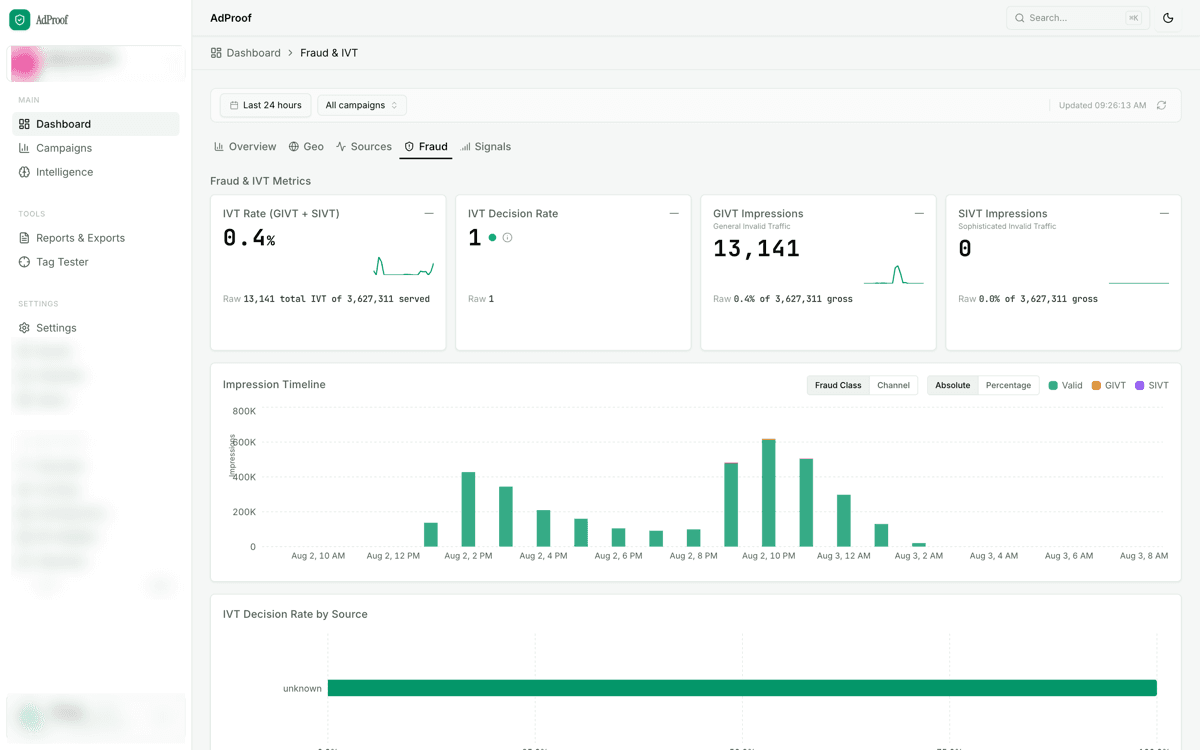
app.adproof.io / dashboard / fraud
The fraud and invalid-traffic dashboard, with client identifiers obscured
Fraud & IVT
Invalid traffic, split by class

GIVT and SIVT counted separately against gross, with an impression timeline, decision rate, and per-source breakdown rather than one blended percentage.
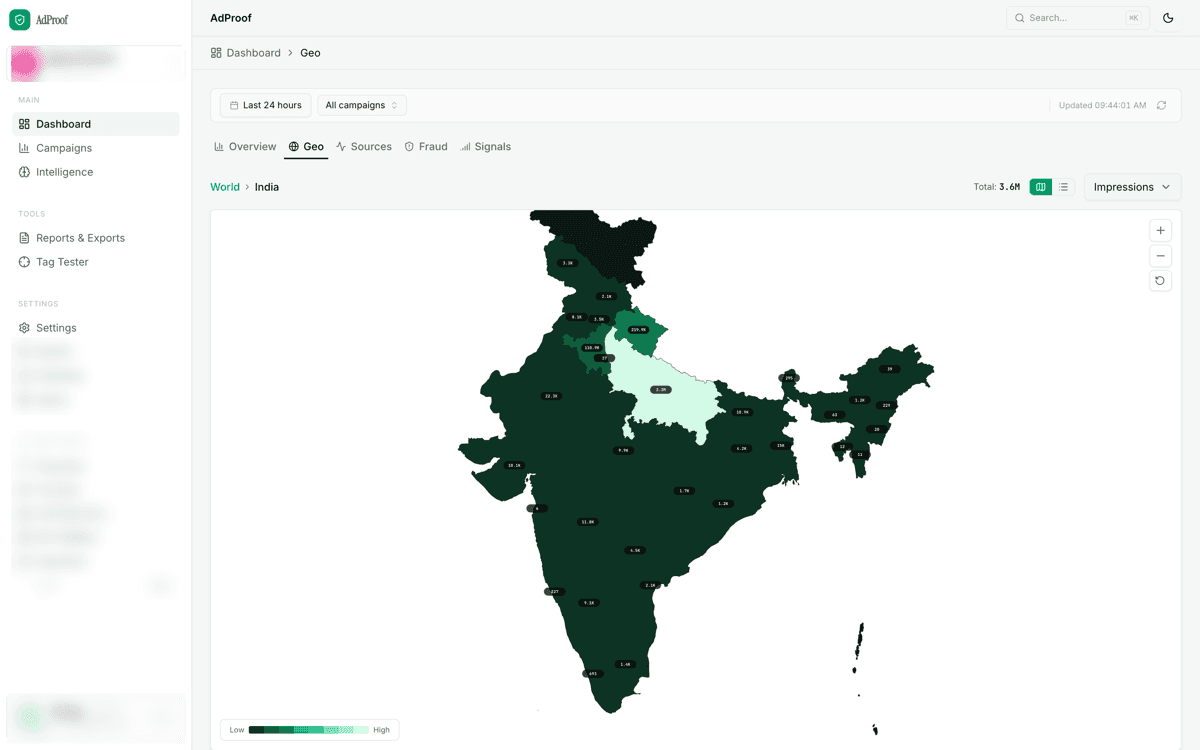
app.adproof.io / dashboard / geo
The geography dashboard showing state-level delivery, with client identifiers obscured
Geo
Delivery down to the city

Drill from world to country to state to city, with impressions, clicks, and video completes at every level of the hierarchy.
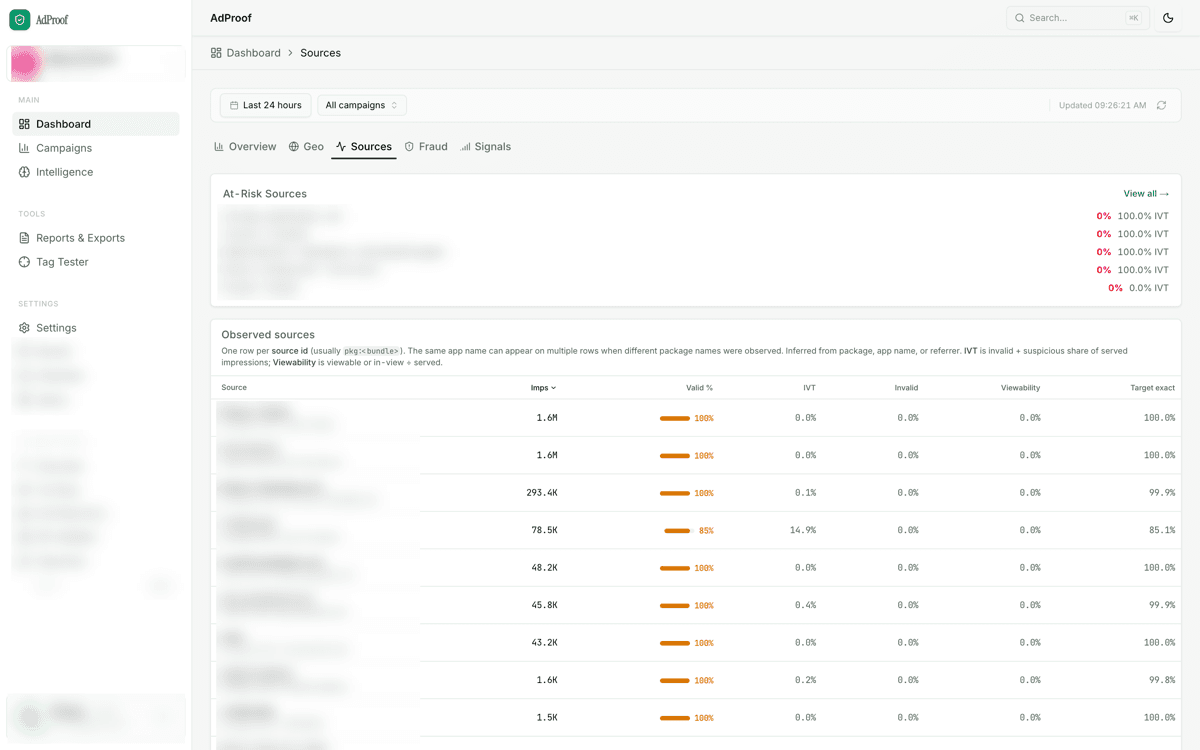
app.adproof.io / dashboard / sources
The source quality table, with source names obscured
Supply
Every observed source, ranked

One row per source id with volume, valid share, invalid rate, viewability, and target match, plus an at-risk list surfaced above the table.
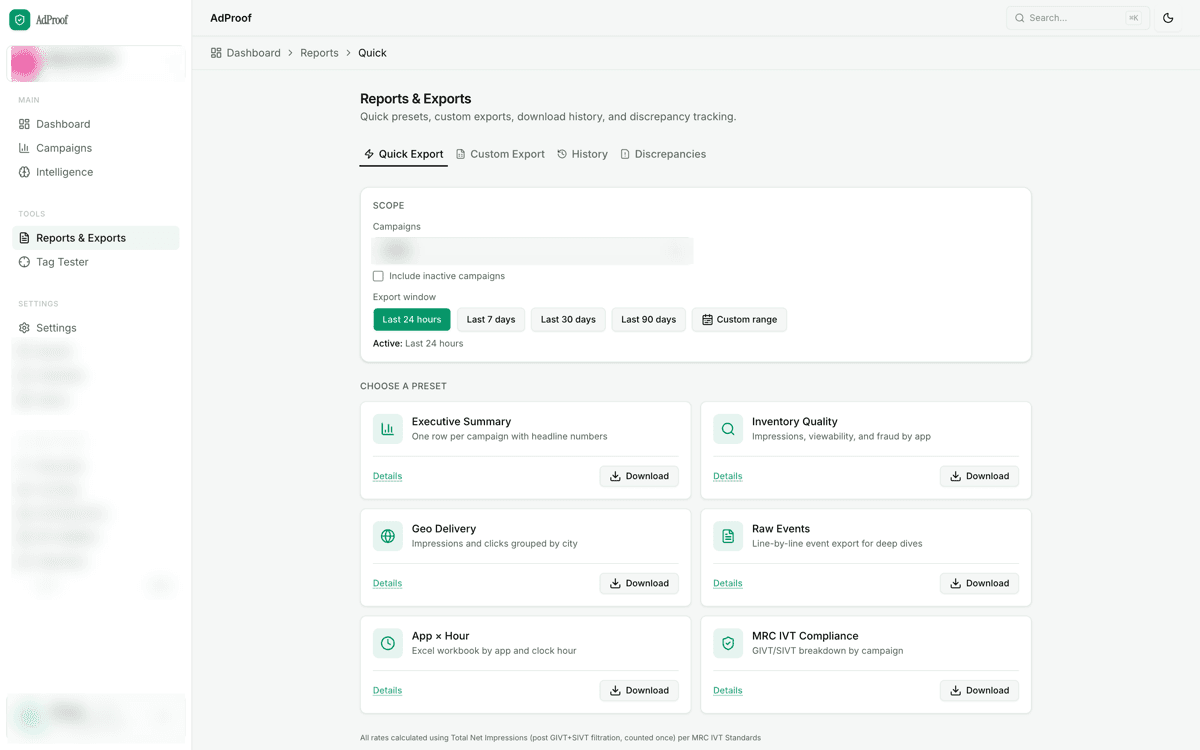
app.adproof.io / reports / quick
The reports and exports screen, with client identifiers obscured
Exports
Presets and raw event exports

Executive summary, inventory quality, geo delivery, MRC IVT compliance, or a line-by-line event file, on any window you choose.

04 – Independence

Buyer and seller argue from one record.

Our counting, filtration, and viewability methodology is documented in full and shared with clients. Detection rules are versioned and dated, and a change that moves reported rates is documented before it ships.

When a seller disputes a flag, they get the same impression-level evidence the buyer got.

How the measurement works →
OwnershipNo DSP, SSP, publisher, or agency holding company holds equity in AdProof.
Revenue modelCharged per measured impression, with no flat fee. For most customers that comes to under 1% of media spend.
MethodologyCounting, filtration, and viewability methodology is documented in full and shared with clients.
Detection rulesVersioned and dated. Changes that move reported rates are documented before they ship.
DisputesDiscrepancies follow a documented resolution process, and the seller sees the same impression-level evidence the buyer sees.
05 – Coverage

What is measurable where, stated plainly.

Not every metric exists in every environment. Vendors who claim otherwise are modelling. We do not model. Every figure below is either an observed signal or it is reported as unmeasurable.

Metric
CTV & OTT
In-stream video
Mobile web
Open web
Impression delivery
DIRECT
DIRECT
DIRECT
DIRECT
Invalid traffic
DIRECT
DIRECT
DIRECT
DIRECT
Duplicate detection
DIRECT
DIRECT
DIRECT
DIRECT
Video completion
DIRECT
DIRECT
DIRECT
N/A
Geo validation
DIRECT
DIRECT
DIRECT
DIRECT
Target match
DIRECT
DIRECT
DIRECT
DIRECT
Reach and frequency
DIRECT
DIRECT
DIRECT
DIRECT
Viewability
N/A
N/A
N/A
DIRECT
DIRECT – observed signalN/A – reported as unmeasurable, never modelled

Viewability needs a client-side measurement hook. Almost everything we measure today is in-stream video in CTV, OTT, and mobile web environments, where that hook does not run, so viewability is reported as unmeasurable rather than modelled into a number that fills the gap.

Measurement principle

“Every number in this product resolves to the impressions behind it. A figure that cannot be opened and inspected does not belong in a report, and a blind spot is worth more stated than modelled.”

How AdProof reports, by design
488,108,716
Impressions removed as general invalid traffic, counted against gross rather than sampled
163,631,212
Duplicate impressions collapsed, so one delivery is counted and billed once
46,499 city names
Observed across 195 countries and territories and 3,215 state and region names as of 25 October 2026
Read the case studies →

Start with one campaign.
See what the log says.

Measure a single campaign alongside your ad server and compare the two numbers. No integration fee, and no obligation to continue.