
- Published
- Oct 25, 2026
- Updated
- Nov 4, 2026
- Reading time
- 29 min read
Viewability Reports Disagree: Compare the Counts Before the Rates
Why do viewability reports disagree? Reconcile measurable impressions, pre-bid predictions, CTV coverage, and vCPM with worked examples and a practical audit.
In this guide (14 sections)
You selected a 70% viewability targeting setting, but the verification report shows 50%. Another report says 75%. Before you move budget or ask a publisher for compensation, establish what each percentage divides by and which impressions each system observed.
If a DV360 record carries cost despite an observed non-viewable outcome, audit the cost fields and their commercial basis separately from this measurement comparison. Media Cost, Total Media Cost, Billable Cost and configured Revenue are different values, and a viewable-cost ratio alone does not establish which charges qualify for a correction.
For a Google Display campaign selected through publisher domains, audit the allowlist, effective content targeting, actual placement report and ad format before attributing a low CTR to poor page position or raising bids. That workflow identifies the delivery population to bring into this viewability comparison.
This guide explains how to compare viewability reports, investigate prediction-versus-measurement gaps, and calculate a defensible cost per thousand measured viewable impressions. It includes a worksheet you can use with your agency, publisher, and measurement partners.
These questions come from real discussions: an ad operator asked why third-party viewability stayed below a pre-bid setting, while another asked how to calculate vCPM with incomplete measurement and CTV inventory. The threads identify reader problems. Their suggested explanations are not diagnoses of your campaign.
The first distinction: viewability is an opportunity to see#
Viewability measures whether an advertisement met specified visibility conditions. It does not establish that someone paid attention, remembered the message, or purchased a product.
When the buying decision goes beyond exposure, audit attention methodology, coverage and validation as a separate task. Keep an estimated attention measure distinct from a viewability result and from evidence that awareness or business outcomes changed.
For conventional desktop display, the MRC baseline generally requires at least 50% of the ad's pixels in view for one continuous second. For video, the usual baseline is 50% for two continuous seconds while playing. Exceptions and environment-specific rules exist; confirm the applicable definition rather than copying a threshold into every report. The MRC viewable ad impression guidelines explain the desktop requirements, including the large-display-ad exception.
A rendered impression and a viewable impression are different records. An ad near the bottom of a page might render before the reader scrolls to it. It can qualify as an impression under the relevant counting method without meeting viewability criteria. Equally, an ad initially below the fold can become viewable after scrolling. Page position alone is insufficient.
The investigation should therefore preserve four separate questions:
- Did the relevant impression occur?
- Was viewability measurement supported and successfully performed?
- Did the measured exposure meet the chosen threshold?
- Did it pass the report's separate validity and scope rules?
For the broader vocabulary, see impressions, views, clicks, reach, and conversions.
Compare the counts before comparing viewability rates
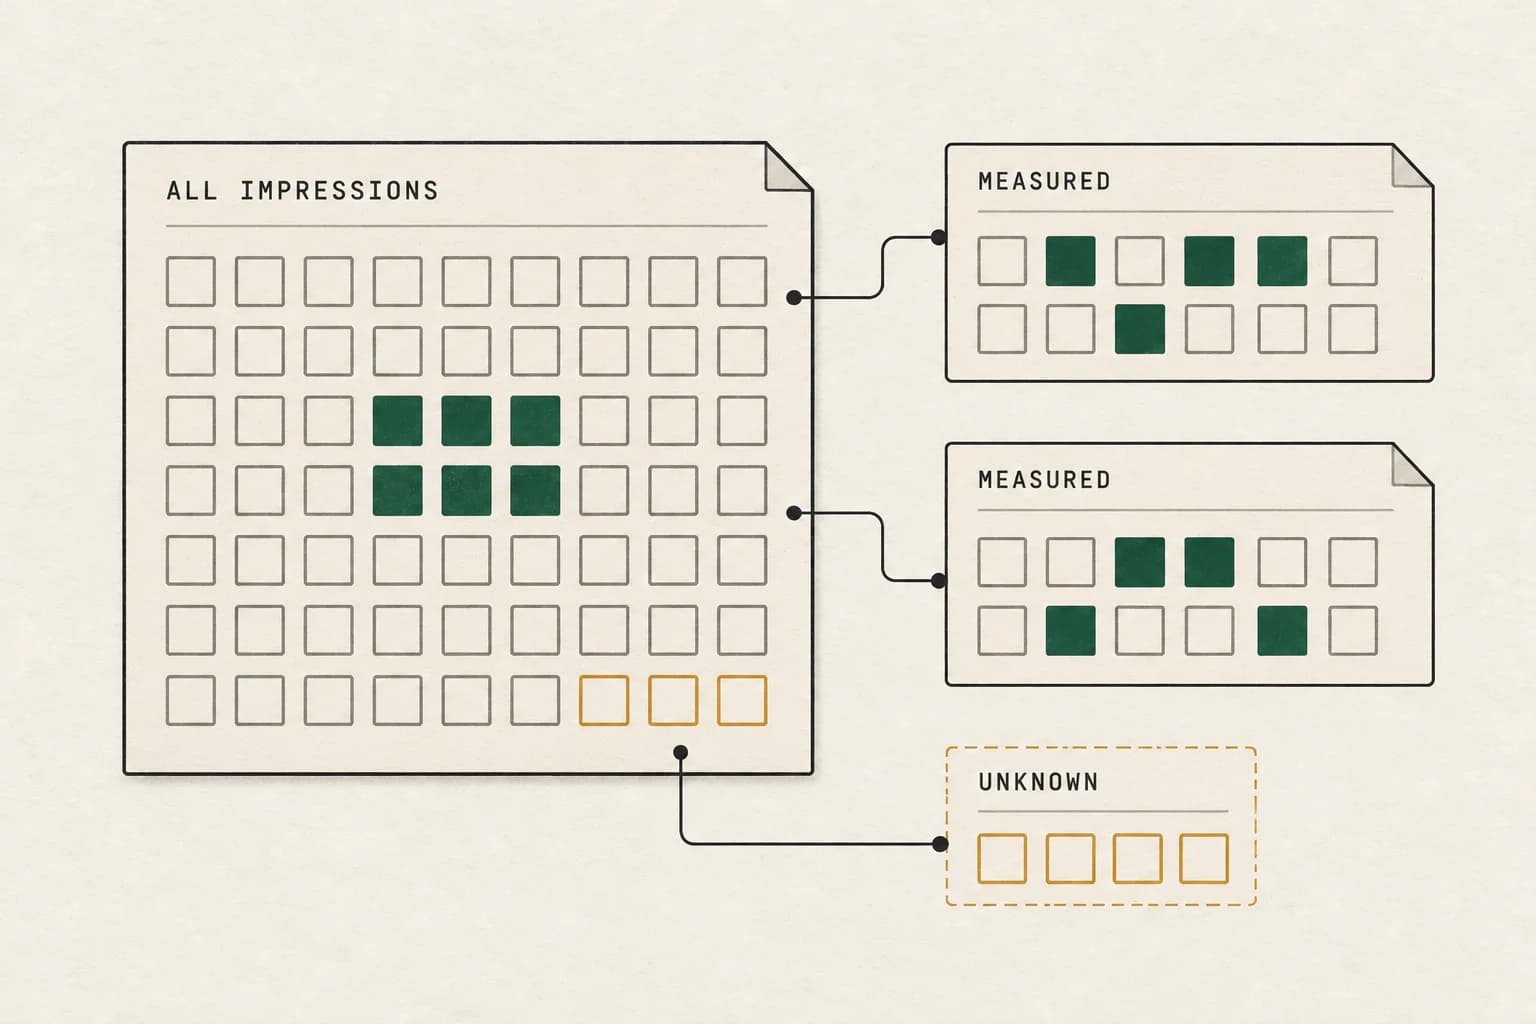
Different denominators and impression coverage can explain why reports show different percentages. Discuss which counts are comparable.
Discuss a measurement questionA short inquiry to scope relevant options; no campaign access is needed.
Put the four counts next to every percentage#
Do not start a comparison with two rates. Start with counts for the same completed reporting interval.
| Quantity | Working meaning for the investigation | Question for the provider |
|---|---|---|
| Total impressions | The campaign impression population in the selected report | Which events and filters define this population? |
| Eligible impressions | Impressions within that product's supported measurement scope | What makes an impression eligible? |
| Measurable impressions | Eligible impressions for which measurement succeeded | What failures or unsupported cases are excluded? |
| Viewable impressions | Measurable impressions meeting the selected criteria | Which pixel, time, environment, and validity rules apply? |
Google Ad Manager explicitly defines Active View viewability as viewable divided by measurable impressions, while its measurability rate uses measurable divided by eligible impressions. Those denominators are not interchangeable. Its Active View reporting documentation also distinguishes non-viewable from non-measurable impressions and lists eligibility limitations.
Write the formula under the number you are discussing:
Measurability rate = Measurable impressions / Eligible impressions

Measured viewability rate = Viewable impressions / Measurable impressions

Observed viewable share of total = Viewable impressions / Total impressions
The third calculation is an audit ratio for your declared population, not a substitute definition for a vendor's viewability metric. It is useful because it makes unsupported or unobserved inventory visible in the discussion.
Worked example: three true percentages, one campaign
The following example is hypothetical. Its counts are chosen to show the arithmetic, not to represent an industry benchmark.
| Stage | Count |
|---|---|
| Total campaign impressions | 1,000,000 |
| Eligible for the selected measurement | 800,000 |
| Successfully measurable | 600,000 |
| Measured viewable | 450,000 |
| Measured non-viewable | 150,000 |
| Eligible but not measurable | 200,000 |
| Outside eligibility scope | 200,000 |
Measurability is 75%: 600,000 divided by 800,000. Measured viewability is also 75%: 450,000 divided by 600,000. Observed viewable impressions represent 45% of total campaign impressions: 450,000 divided by 1,000,000.
All three statements can be correct. None demonstrates that the remaining 550,000 impressions were unseen. That remainder includes 150,000 measured non-viewable impressions and 400,000 impressions without an established outcome in this measurement.
Do not quietly turn the unknown group into either viewable or non-viewable impressions. If a provider offers a separately modeled estimate, identify its method and uncertainty and keep it apart from the directly observed counts.
A pre-bid percentage is not a post-bid guarantee#
Pre-bid viewability targeting selects opportunities using information available before purchase. Post-bid measurement observes what happened after the opportunity was bought and the ad was delivered. A prediction and an observation can disagree without either number being fabricated.
For a concrete implementation, Display & Video 360 describes its Active View targeting percentage as a predicted likelihood, used to decide which impressions to bid on. Its documentation also describes CTV exemptions from those settings. That is Google's implementation, not a universal specification for IAS, DoubleVerify, or every DSP.
When a campaign set to “70%” reports 50% measured viewability, ask what the setting meant in that particular integration. Was it a likelihood threshold for individual opportunities, a historical placement average, an optimization objective, or a contractual delivery condition? Those interpretations require different checks.
Use this sequence:
- Export the effective settings, including advertiser-level defaults and line-item exceptions.
- Identify the provider and exact pre-bid segment or model.
- Confirm when the setting became active and whether the measured interval precedes it.
- Check which inventory formats and deals the setting covered.
- Compare the pre-bid definition with the post-bid metric, threshold, and provider.
- Break measured results down by placement, app or domain, device, and day.
A campaign-wide gap may reflect a large exempt inventory segment rather than a weak prediction on eligible supply. Conversely, a single high-volume placement with a new layout or player change merits a focused integration investigation.
Do not solve this by raising the threshold repeatedly without checking coverage. You may reduce available inventory while leaving the broken measurement path untouched.
Compare providers on a common population#
Two providers can each report a 70% viewability rate while observing different impressions. They can also disagree because the same impression was measured differently. These are separate problems.
Create three comparison groups if permitted identifiers and data access allow it:
- Impressions measurable by both providers.
- Impressions measurable only by provider A.
- Impressions measurable only by provider B.
Within the shared group, compare viewability classifications and investigate conflicting cases. Outside it, investigate measurement coverage. A comparison limited to the shared group says nothing about the unobserved remainder, so publish both coverage and classification results.
If event-level matching is unavailable, compare the narrowest stable aggregate slices. Match campaign, creative, placement, device, format, day, time zone, and processing status. Record ID mappings explicitly; similarly named fields can use different identifiers.
| Difference | What to request | What would strengthen the finding |
|---|---|---|
| Different eligible counts | Support rules and deployment coverage | Placement-level evidence explaining excluded inventory |
| Different measurable counts | Measurement failure or limitation reasons | Controlled tests on the affected player or environment |
| Same measurable population, different classification | Thresholds and session-level measurement traces where available | A reproducible disagreement under a documented test |
| Similar raw counts, different final reports | Filtration, deduplication, and report definitions | Receiver-side processing records and reconciled exports |
| Gap begins after a release | Before-and-after SDK, layout, or tag versions | A regression reproduced on the changed path |
Avoid treating the larger count as inherently more accurate. A broader method can have more coverage but different assumptions. A narrower method can provide better-defined observations while missing a substantial part of delivery.
Separate YouTube vendor enablement from a player-tag investigation#
An older archived question about YouTube viewability discrepancies describes different results on two inventory arrangements. Its replies disagree about whether the relevant path is a player-side verification tag or an Ads Data Hub integration. The reported percentages do not establish an acceptable discrepancy or diagnose either arrangement.
First identify what the report actually includes. A YouTube & partners line-item label does not replace evidence of the inventory, format and measurement route for the rows being compared. Separate actual YouTube delivery, partner-site or app delivery, and unclassified rows. Ask the measurement provider which integration applies to each supported population; do not transfer one route's implementation instructions to the others.
Google's current YouTube third-party measurement guidance says it does not accept third-party tracking pixels for YouTube measurement. It documents verified measurement vendors, advertiser-level activation and line-item activation. The separate DV360 setup reference describes measurement through Ads Data Hub. A browser tag or OMID integration elsewhere therefore cannot, by itself, establish that this YouTube reporting route is enabled.
Keep the provider's measurement product and account mapping with the comparison. Google's setup requires the vendor client ID supplied by the measurement partner; line items also have measurement selections and a reporting ID where applicable. Confirm these with the responsible teams rather than copying an identifier from another advertiser or assuming a familiar vendor name means the account is connected.
Use this acceptance matrix before trying to repair the player:
| Review branch | Evidence to obtain | Decision it supports |
|---|---|---|
| Actual YouTube delivery | Inventory and format scope, enabled measurement type, correct vendor/account and line-item mapping | Whether the documented YouTube measurement route was configured for this population |
| Partner website or app delivery | Provider-confirmed supported integration, renderer and event responsibilities | Whether a player/resource diagnostic is relevant to those rows |
| Mixed or unclear reporting | Uncombined exports and an explicit inventory split | Which part can be compared and which remains unresolved |
| Provider data received but absent from the selected view | Provider receipt, report product, IDs, dates and eligibility definition | Whether the remaining issue is reporting scope rather than collection |
These are recommended audit records, not a promise that the platform exposes every field at impression level. Preserve an unknown category when the inventory split is incomplete. Do not convert that remainder into non-viewable impressions or assume it is all CTV.
Check the effective settings at the time of delivery. Google notes that on-by-default selections populate newly created line items, and that vendor-client-ID changes do not automatically update existing line items without the documented line-item edit process. Format support also varies. Record which existing and new line items were actually covered; a current advertiser screenshot is not historical enablement evidence. Current activation and support considerations
If a configuration repair is needed, have the authorized owner make the supported change and validate its prospective scope. Keep the earlier export and implementation state. Do not claim missing historical measurements were backfilled unless the receiving provider supplies evidence of that behavior.
Finally, compare the same measurement type and denominator within each verified route. A larger gap on one inventory arrangement is a reason to investigate its scope and implementation, not proof of SDK failure, reporting priority or invalid traffic. This branch narrows the next action: vendor enablement and mapping for the YouTube route, or a supported player/verification investigation where that integration actually applies.
For a client CM360 report that lacks YouTube delivery, audit the advertiser link, creative source, tracking-ad assignment and report contract before treating vendor enablement as the missing step. The current CM360 reporting route and a third-party viewability provider are separate mappings.
Investigate the integration before blaming the inventory#
A low measurable rate is an integration or support question before it is a placement-quality conclusion. Check whether measurement was deployed everywhere expected, initialized at the correct time, and associated with the correct ad view.
When a creative or provider behaves differently inside a frame, audit the actual SafeFrame and supported rendering path before interpreting a missing viewability signal.
For web video, inspect the player, iframe configuration, verification resource loading, and actual runtime errors. For apps, capture the app version, ad SDK, measurement integration, and obstruction handling. A network request to an impression tracker does not prove viewability signals were available.
Google's IMA Android Open Measurement guide provides a concrete example: the integration consumes VAST verification resources, and unregistered overlays can affect viewability. Controls should be registered only when they qualify as friendly obstructions under the integration's rules. Hiding real obstructions to improve a metric defeats the purpose of measurement.
For web integrations, IAB's Open Measurement access-mode documentation explains why access to the creative or page differs between modes. Confirm compatibility with the measurement provider. Do not widen script access solely to make a dashboard turn green without reviewing the integration's requirements. If a vendor script executes but its report remains empty, separate local OMID validation from provider-report evidence before calling the inventory non-viewable.
When an ordinary VAST impression fires but the viewability callback does not, use the separate VAST ViewableImpression debugging guide. That problem needs a trace of supported measurement and event handling, not an assumption that every impression should produce a viewable event.
For an app with high click-through rates, separate app callbacks from traffic-quality decisions. An SDK observation also does not replace independent evidence that an impression met a viewability definition.
Hybrid apps: audit the renderer before changing the threshold
An older hybrid-app question about unmeasurable WebView impressions received conflicting advice about whether Open Measurement applied. The useful distinction is the rendering and measurement path, rather than whether the product is called an app. A low measurable share and a low viewability rate among measurable impressions remain different problems.
First identify what contains the ad: a whole web page inside a WebView, an HTML ad inside an otherwise native screen, or a native ad view. Record the tag or ad SDK that renders it, mediation adapter where relevant, session owner, provider and exact versions. Confirm which component owns impression and video events. Do not add a second integration merely because the first report is incomplete.
If the rich-media failure concerns mraid.js or a native interaction, audit the host SDK bridge and its owner separately from the measurement session. A creative rendering, an available JavaScript interface and the expected native behavior need different acceptance evidence; none alone settles a viewability report.
IAB's Android OM SDK implementation guide has separate WebView-display, WebView-video and native paths. For its WebView path, session creation must wait for the measurement JavaScript to load; the measured view and event ownership must match the actual rendering arrangement. Ask the integrator for the applicable session trace, not just evidence that an SDK dependency exists.
Google's WebView API for Ads guide describes app signals reaching supported ad tags through registered WebView instances. A successful registration test establishes that connection, not that every verification provider can measure every ad. Match the installed SDK branch: the linked Next-Gen guide requires version 1.0.0 or later; the separate Legacy guide documents a different SDK family and prerequisites. Do not copy initialization instructions between them.
For SDK-rendered inventory, Google's Legacy Android Open Measurement reference separately requires provider configuration and checking mediation-partner support for ads that partner renders. Its version claims concern that documented integration, not every ad displayed in a registered WebView.
Run a small authorized acceptance matrix on the affected path:
| Test condition | Evidence to preserve | Acceptance question |
|---|---|---|
| Ad visible with no overlapping native UI | Correct measured view, session timing and provider result | Does this supported baseline become measurable? |
| Ad scrolls out of the visible area | Geometry and visibility transitions with timestamps | Does measurement follow the actual ad rather than its old container? |
| App backgrounds and returns | Lifecycle transitions and the same test's measurement record | Are state changes reflected without treating missing data as viewable? |
| Dialog or playback control overlaps the ad | Native view hierarchy and obstruction registration | Is actual occlusion retained, with only qualifying controls treated as friendly? |
| WebView content or ad is replaced | View association and session ownership for each ad | Is each ad measured through the intended lifecycle? |
Retain unsupported and unavailable results. For overlays, use the rules for the renderer being tested. The Legacy Google guide notes that a transparent background alone does not make a native overlay non-obstructing. Correct unintended geometry or registration defects; do not hide meaningful UI or declare real covering content friendly to improve a percentage.
One current optimization has a narrower scope than its headline may suggest. IAB's Android sandboxed-JavaScript update describes an opt-in executor for native ad sessions in OM SDK 1.6.10, with fallback behavior. It explicitly excludes integrator-provided WebView HTML/JavaScript sessions from that support. Upgrading this native-session executor is therefore not, by itself, a fix for a hybrid HTML ad's missing measurement.
Compare eligible, measurable and viewable counts for the same tested renderer and completed period. A repaired support path may increase measurability without increasing the measured viewability rate. Report that narrower outcome, then retain the acceptance evidence with the relevant app release.
A visible second monitor needs more than a focus check#
A publisher question about dual-monitor viewability and outstream refresh describes ads remaining on a second screen while a game has focus. The useful question is which observation or rule changed, rather than whether the entire audience should be classified as invalid.
The browser's focus, the document's visibility, the ad's measured viewability, and the traffic-quality verdict are separate states. MDN's Page Visibility API documentation explains that a window losing focus does not necessarily mean its document is hidden. A visible page also does not establish the ad's pixel exposure, qualifying duration, or human attention.
The MRC desktop viewability guidelines include an in-focus browser-tab condition and warn that Page Visibility signals alone cannot determine viewability. Ask the measurement provider how it handles the actual browser and multi-window arrangement. Do not translate a blur event into an IVT finding, or translate document.hidden === false into guaranteed viewable delivery.
Separate a timer decision from a measured event
Use an authorized test page to trace these cases before changing the live refresh rule:
| Test case | Record separately | Decision it can support |
|---|---|---|
| Browser remains visible while another application gains focus | Focus event, document visibility, slot measurement, timer state | Whether the custom focus gate suppressed requests |
| Reader switches to another browser tab | Visibility transition and request timestamps | Whether background refresh continued unexpectedly |
| Sticky ad remains in the viewport | Supported pixel/time result and obstruction evidence | Whether the actual impression qualified under the chosen measurement |
| Page stays open without recent input | Last permitted interaction, refresh reason, quality report scope | Whether an inactivity rule needs review with the provider |
Hypothetical example: a timer logs ten suppressed refresh opportunities because focus moved to a game. That is ten decisions not to request another ad. It is not ten received impressions, ten measured non-viewable impressions, or ten invalid impressions. Compare suppression records with actual request and impression IDs; keep the counting populations separate.
Check the applicable refresh declaration and player contract
For inventory governed by Google Ad Manager's publisher refresh declarations, verify the trigger type, minimum interval, and targeted inventory against runtime behavior. Those declarations apply to the demand channels named in Google's documentation. They describe the refresh; they do not implement it. Gameplay clicks and mere page activity do not qualify as user-action refreshes under that guidance. Do not generalize these Google requirements to every SSP or demand contract.
For display slots using GPT, Google's ad-loading and refresh guide recommends avoiding refreshes more frequent than every 30 seconds and unnecessary clear() calls before refresh(). A 30-second timer is not a certification of valid traffic, viewability, or policy compliance.
A third-party outstream player needs its own supported lifecycle and demand rules. Do not apply a display-slot example to it without checking those rules. Record player-instance IDs, mount/unmount times, ad requests, impression beacons, errors, and cleanup behavior. Ask the integration owner whether rebuilding the container creates another ad opportunity or interrupts an existing one; do not assume either repeated teardown or continuous looping is universally correct.
Finally, request the provider's exclusion category, affected time window, and denominator before attributing deductions to focus or idle time. A fall in refresh volume establishes neither the cause of the earlier deductions nor an improvement in traffic validity. Use the IVT evidence request to keep that review separate from the viewability comparison.
Handle CTV as a support matrix, not one universal answer#
The claim that CTV viewability cannot be measured is too broad. So is the claim that a television's full-screen video is automatically a measured viewable impression.
IAB Tech Lab's Open Measurement SDK documentation describes native CTV support and web-video support for Samsung and LG devices. Availability depends on the actual app, device, SDK, player, and verification integration.
Build a campaign-specific matrix:
| Inventory slice | Integration and version | Viewability supported? | Measurement successfully observed? | Report treatment |
|---|---|---|---|---|
| App and device group A | Record exact implementation | Confirm with provider | Validate on authorized test playback | Measured or stated limitation |
| App and device group B | Record exact implementation | Confirm separately | Validate separately | Keep unknowns visible |
| SSAI path | Identify client measurement alongside server beacons | Confirm supported architecture | Trace client signals and receiver records | Separate impression tracking from viewability |
Check accreditation at the metric and environment level if it matters to your agreement. The MRC digital accreditation listing distinguishes environments and can include application-specific limits. A company-level accreditation claim does not establish that every metric in every CTV app is covered.
For impression-count reconciliation around streaming delivery, use CTV impression discrepancies and the SSAI verification guide.
Calculate vCPM without inventing viewable impressions#
A useful descriptive calculation is campaign spend per thousand directly measured viewable impressions:
Observed vCPM = Spend / Directly measured viewable impressions × 1,000
The spend and impression population must match. Label exactly which costs are included: media only, media plus verification fees, or another declared scope. A platform's reported cost metric can use different allocation rules; compare its documented definition before expecting identical results.
Consider this illustrative campaign:
| Quantity | Value |
|---|---|
| Media spend | $10,000 |
| Total impressions | 1,000,000 |
| Measurable impressions | 600,000 |
| Directly measured viewable impressions | 450,000 |
| Standard CPM on total impressions | $10.00 |
| Campaign spend per thousand measured viewable impressions | $22.22 |
The $22.22 calculation is $10,000 divided by 450,000, multiplied by 1,000. It uses campaign spend against confirmed measured viewable outcomes and therefore reflects incomplete coverage as well as media quality.
You should not apply the measured 75% viewability rate to all one million impressions and claim 750,000 measured viewable impressions. That extrapolates the observed subset into unsupported or unmeasured inventory. It produces $13.33, but it answers a different, assumption-dependent question.
If spend can be reliably allocated to the measured subset, calculate a separate subset cost metric and disclose the allocation. For example, $6,000 of documented spend associated with those 450,000 viewable impressions produces $13.33 per thousand. Do not assume the subset cost is proportional to impression volume when prices vary by device, deal, or placement.
Where there are zero measured viewable impressions, report the cost and zero count. Do not display a finite vCPM or replace missing measurements with estimated views.
When viewability exceeds 100%, preserve the row before fixing the rate#
An archived ad-operations question from March 2020 asks why an Apps & URLs report showed 624% viewability for one website. It is an older reporting problem with a useful current diagnostic lesson: an impossible-looking percentage needs its underlying counters and reporting scope. The number alone cannot identify a broken script, duplicate measurement, or invalid traffic.
For a matched, fully reconciled cohort, every counted viewable impression belongs to the measurable population. That subset relationship gives a viewability rate between zero and 100%. A report row can fail to represent that matched cohort. First check whether the numerator and denominator are the same metric family, interval, inventory slice, and processing stage.
Google Ad Manager's troubleshooting guidance explains that Active View uses independently transmitted events; losses can produce out-of-range rates on small counts. Its stated reporting SLA applies at 100 or more daily impressions aggregated at campaign, creative, or customer level. Do not apply that assurance to every tiny URL, app, or hourly row. That documentation describes a possibility, not the confirmed cause of a particular 624% result.
Use counts to separate an isolated anomaly from the wider result
Export the original row before changing dimensions or filters. Retain the report name, metric labels, selected dates, time zone, export time, IDs, and raw counts. If the platform does not expose the denominator, request it; a percentage screenshot is insufficient for reconstruction.
Hypothetical arithmetic example: suppose two non-overlapping rows cover the same completed interval and use the same metric definition, and the export contains these counters:
| Exported row | Measurable counter | Viewable counter | Viewable ÷ measurable |
|---|---|---|---|
| Small row A | 4 | 8 | 200% |
| Larger row B | 996 | 692 | 69.48% |
| Combined counters | 1,000 | 700 | 70% |
These are deliberately anomalous reporting counters, not a physically valid sequence of eight distinct viewable impressions within four measurable impressions. The example demonstrates why the arithmetic mean of the two displayed rates, 134.74%, would misstate the combined counters. Sum compatible counts, then divide. Never average rates without their weights.
The 70% aggregate does not repair or explain row A. Preserve and investigate it. Equally, row A does not establish that the entire campaign delivered at 200%. Record the anomalous row's absolute count alongside its rate, and rank the investigation against other discrepancies by count. With a zero denominator, label the rate undefined and retain the counters; do not replace it with zero or 100%.
Check the time boundary without inventing a universal lag rule
Campaign Manager 360 documents a specific end-of-day edge case: eligibility may be recorded before midnight while later measurement appears on the following date. This can produce unusual daily rates. That is CM360 behavior described in its support documentation, not evidence that another platform assigns events in the same way.
For the affected report, ask whether each counter is assigned by impression time, measurement time, ingestion time, or a report-specific convention. Record time zone and daylight-saving behavior where relevant. Compare a closed interval spanning the boundary, using the same filters and identifiers; preserve the daily exports too. If the discrepancy changes, that supports a timing hypothesis, but does not prove it until the provider confirms the event assignment or supplies matching records.
Do not promise that waiting a fixed number of hours will resolve it. Use the provider's actual processing guidance and record both export times. A changing report is evidence of a revision, not by itself an explanation of the revision.
| Observation | Next check | Evidence needed before assigning a cause |
|---|---|---|
| One small breakdown row exceeds 100% | Reconstruct its counters and inspect the wider supported aggregate | Original export, dimension mapping, compatible count totals |
| Anomaly clusters near midnight | Compare event assignment and a boundary-spanning interval | Time zones, event/report timestamps, provider confirmation |
| Measurable count exceeds total impressions | Verify both populations and delayed-impression implementation | Counting definitions and authorized creative/runtime trace |
| Anomaly persists at meaningful aggregate volume | Escalate under that product's documented reporting scope | Reproducible report settings, absolute counts, stable IDs |
CM360 also flags incorrectly implemented delayed impressions on custom HTML creatives as one reason measurable counts can exceed total impressions. Use that as a targeted integration check only where the setup actually matches. It is not a general diagnosis for every viewability anomaly.
Send support a compact evidence packet: untouched exports, both calculation formulas, the anomalous IDs and dates, affected absolute counts, integration versions, any authorized receiver-side records, and the result of the boundary comparison. Separate confirmed facts from hypotheses. Avoid capping the stored rate, dropping inconvenient rows, or relabeling missing measurement as non-viewable; each would conceal the issue the review needs to resolve.
A practical reconciliation worksheet#
Copy this structure into a shared investigation document. Use separate rows for formats and environments with materially different support.
Campaign, interval, time zone, export time:
Provider and report:
Metric definition and selected threshold:
Total / eligible / measurable / viewable / non-viewable counts:
Filtration and deduplication rules:
Anomalous row IDs, absolute counts, and denominator:
Event-to-report date assignment and boundary comparison:
Original and repeated export timestamps:

Pre-bid provider and segment:
Effective configuration, activation time, and exceptions:
Post-bid provider and integration version:
Coverage by placement, device, and app/player:

Largest mismatch by absolute count:
Evidence available for the shared measurable population:
Controlled test result and receiver confirmation:
Confirmed cause / hypothesis / unresolved limitation:
Owner, proposed change, and validation interval:

Cost scope:
Directly measured viewable count:
Observed cost per thousand measured viewable impressions:
Any separately modeled estimate and its assumptions:
Rank affected slices by the number of impressions they contribute to the discrepancy, not only the percentage. A small unstable slice can distract from the player integration responsible for most of the campaign's missing measurement.
After a change, compare a completed reporting interval with the original definitions. Verify both the viewable count and measurement coverage. A higher viewability percentage accompanied by sharply lower coverage may simply mean the report now sees an easier subset.
Frequently asked questions#
Does below-the-fold delivery count as an impression?
It can, depending on the impression-counting method. It does not automatically qualify as viewable. Check whether the ad actually entered view, how much was visible, and for how long. Avoid assigning viewability using page position alone.
Why can a 70% pre-bid setting produce 50% measured viewability?
First establish what “70%” means in the selected product. Then check exceptions, deployment, effective dates, measurement coverage, and post-bid criteria. A prediction is not an observed guarantee. A large gap still deserves investigation using the actual inventory and integration.
Should unmeasurable impressions count as non-viewable?
Keep them separate. Measurement failure means an outcome was not established under that method. Combining unknown and observed non-viewable impressions hides whether the corrective action concerns delivery quality or measurement support.
Why can a viewability report show more than 100%?
Check the raw counters and scope first. Independently transmitted events, report timing, or a mismatched population can produce anomalous report rows. Google documents specific Active View cases; confirm which applies before assigning a cause. Preserve the original export and escalate persistent anomalies under the relevant product's documented reporting scope.
Does a completed CTV ad count as viewable?
Completion and viewability are distinct. Confirm what generated the completion and which supported client measurement established visibility. A server beacon or full-screen assumption should not silently become a measured viewable count.
Is a visible but unfocused second monitor automatically invalid traffic?
No verdict follows from that browser state alone. Focus, document visibility, measured ad viewability, refresh eligibility, and IVT classification need separate evidence. Ask the provider for its applicable measurement and refresh rules, then reconcile its exclusion reasons against the actual events.
Make the result useful for the next campaign#
Keep a reconciled count table, an inventory support matrix, and a versioned settings record. Those artifacts tell the next buyer whether the campaign needs a placement change, an integration repair, or clearer reporting definitions. The dairy video measurement case shows why impression-quality counts should remain separate from viewability and completion measures; it does not supply a viewability benchmark.
Explore AdProof's measurement approach and measurement workflows, or discuss a campaign review. Bring the count worksheet and the largest affected inventory slices so the discussion starts with evidence.
Sources and research notes#
Initial research: 25 October 2026. Focus, visibility, and refresh sources checked on 26 October 2026. Reporting-anomaly and timing sources checked for this proposed update on 28 October 2026; the linked 624% question is an archived March 2020 example, not a recent demand spike. Calculations, worksheets, and diagnostic examples are original illustrative material, not customer results or claimed performance benchmarks. The linked forum questions establish reader demand; primary documentation supports the technical distinctions.
Related reader questions include why viewability providers use different methodologies and whether below-the-fold ads count as impressions. These questions were checked in the browser during the initial research; their older answers are not used as current technical guidance.
-
IAB Tech Lab: Open Measurement SDK and web-video access modes.
-
Campaign Manager 360: Active View support and end-of-day discrepancies.
Compare the counts before comparing viewability rates
Different denominators and impression coverage can explain why reports show different percentages. Discuss which counts are comparable.
Discuss a measurement questionA short inquiry to scope relevant options; no campaign access is needed.